acf domain was triggered too early. This is usually an indicator for some code in the plugin or theme running too early. Translations should be loaded at the init action or later. Please see Debugging in WordPress for more information. (This message was added in version 6.7.0.) in /var/www/badley-ashton.co.uk/public/wp-includes/functions.php on line 6121post-duplicator domain was triggered too early. This is usually an indicator for some code in the plugin or theme running too early. Translations should be loaded at the init action or later. Please see Debugging in WordPress for more information. (This message was added in version 6.7.0.) in /var/www/badley-ashton.co.uk/public/wp-includes/functions.php on line 6121Thin-section description
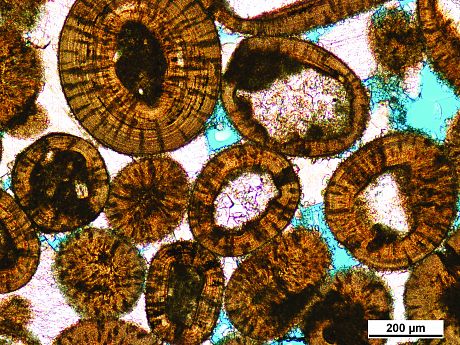
• Blue-dyed resin impregnated and carbonates and K-feldspar stained thin-sections are described for mineral and texture determination, as well as pore-system and reservoir quality understanding.
• Qualitative observations are combined with quantitative mineral identification by using modal and textural analysis.
• Modal analysis is undertaken by counting a minimum of 300 points for both mineral identification and macroporosity.
• Textural analysis for evaluation of the grain-size is also undertaken by measuring 100 grains.
• Quantitative analysis of pore size, shape, frequency of occurrence and abundance of pores is performed by using a petrographic image analysis software. The quantitative data are integrated in the reservoir quality part of the description, together with CCA, MICP and micro CT scan data.
Thin-sections are provided and appropriate descriptions supplied with annotated photomicrographs, thin-section scans, MICP and CCA plots and micro CT images.
Scanning electron microscopy
Secondary electron and backscattered electron analyses are undertaken on native and cleaned rock chips as well as polished blocks/thin-sections. Alternatively, carbon coated or uncleaned (reservoir state) and uncoated samples are analysed in variable pressure mode.
Specific SEM applications are:
• Identification and description of microscopy, mineralogical phases and their paragenetic relationships by using high-resolution images.
• Acquisition of elemental maps or spot chemical analyses using EDS.
• Discrimination phases based on mean atomic number (commonly related to relative density) using backscattered images.
Up to 4 images per sample are taken, described and integrated with thin-section observations.


Cathodoluminescence
Specific cathodoluminescence applications:
• Provenance interpretation.
• Clastic diagenetic process determination:
– compaction (mechanical/chemical)
– plastic/brittle deformation
– cementation – quartz, feldspar, carbonate, clay minerals
– mineral replacement/neomorphism
• Carbonate petrography/diagenesis:
– cement stratigraphy
– skeletal petrology
– diagenetic environmental conditions (Mn, Fe variations).
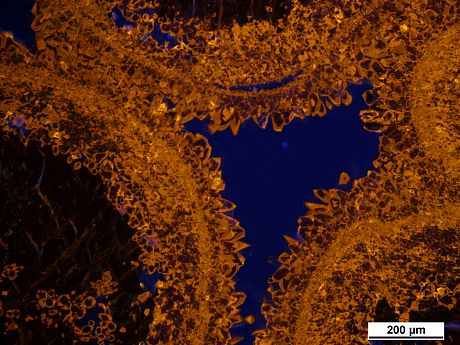
Cathodoluminescence observations are integrated in appropriate descriptions supplied with annotated photomicrographs.
Stable isotopes analysis
Specific information provided from analysis and interpretation of stable isotopes (O, C, Sr):
• Diagenetic environment and temperature of diagenetic fluids (δ18O).
• Possible meteoric water involved in the diagenesis, or whether CO2 from organic matter maturation was available during diagenesis (δ13C).
• Composition either of diagenetic fluids from which the phases precipitated, or of the fluids with which they subsequently reequilibrated (87Sr/86Sr).
Supporting diagrams and interpretations are supplied.
Fluid inclusions
Specific information provided by fluid inclusion microthermometry:
• Temperature of diagenetic fluids (homogenisation temperatures – Th).
• Salinity of the fluids by measuring the final melting temperature (Tmf).
• Fluid composition: first melting temperature (Tme).
• P-T history of the sample.
Supporting diagrams and photomicrographs are supplied.
