Petrographic Image Analysis

Badley Ashton uses petrographic image analysis (PIA) as an additional method to predict reservoir quality, through a quantitative analysis of pore size, shape, frequency of occurrence and abundance.

Quantitative analysis of thin-section images

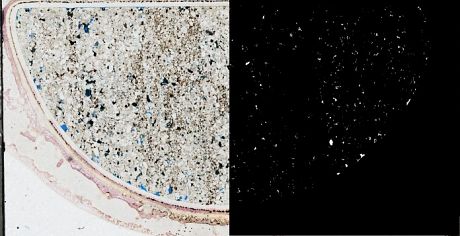
PIA is performed on thin-sections using an image acquisition system and analytical software. The acquired images are binarised into solid (matrix) and pore phases, allowing pore spaces to be identified and measured. The PIA technique is applied to high-resolution resin impregnated thin-section scans, BSEM and CL photomicrographs.

Pore system characterisation:

  • A high-resolution thin-section scanned image (HRTSI) of a complete thin-section is captured using automated microscopy equipment and analysed for mesoporosity and macroporosity estimation.
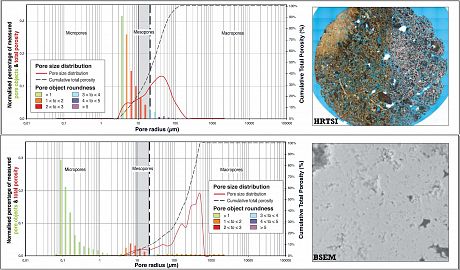
  • BSEM images are acquired to capture micropores in mud-dominated samples and data combined with the macroporosity estimation to provide a pore size distribution over several orders of magnitude.
  • Analysis of the combined dataset builds into a semi-quantitative breakdown of the pore network over a range previously unavailable to conventional petrographic analysis.
  • Estimates of total porosity pore size distribution and pore shape parameters (ie. roundness), are routinely detected and provided.

Quantification of the abundance of quartz cement through the image analysis of Optic CL of thin-sections is also provided.
content-7-74-image_analysis1
content-11-74-pia_images

Analysis from different source images

PIA on High Resolution Thin-section Images
The analysis of high-resolution thin-section scanned images (HRTSI) gives good results for grain-rich carbonate and clastic samples.

  • Pore-size distribution (PSD) diagrams are created after a statistical study of the pore-size abundances.
  • Pore sizes over seven orders of magnitude (5µm2 to 5,000,000µm2) are differentiated, and their relative contribution to the total porosity – calculated and plotted.
  • The resultant PSD curves typically show a very good agreement with MICP pore-throat size distribution plots particularly within macropore-dominated lithofacies; suggesting PIA as a potential, non-destructive, alternative to MICP.
  • The major limitation of petrographic image analysis, performed only using an optical microscope is the difficulty in accurately measuring pore sizes below 8-10µm. In order to circumvent this, the use of BSEM images is recommended if the sample set is micropore-dominated (see below).

The potential offered from PIA PSD diagrams, compared to conventional MICP pore-throat size distribution plots, is the possibility to increase the quantitative relationship between the petrographical observations and the effective pore network, providing the unique opportunity to better understand the depositional and/or diagenetic controls over reservoir quality. Potential enhancements to rock-typing schemes (especially in carbonates) through the better quantification of pore systems and pore types are also provided.

PIA on Backscatter Scanning Electron Microscope Images
In micropore-dominated systems, the use of BSEM images is needed for image analysis in order to capture the pores with a size below 8-10µm.

  • A defined number of images are processed and the results integrated with the data obtained by the analysis of the images obtained from the optical microscope.
  • Three pore area ranges are added to the pore size distribution diagram which now includes pore areas from <0.05µm2 to 5,000,000µm2.
  • The resultant curves show a very good agreement with MICP pore-throat size distribution plots for both macro and micropore-dominated pore systems.

Currently Badley Ashton is investigating the application of this integrated PIA technique to the analysis and characterisation of pore networks within unconventional carbonate reservoirs and shales, where it may provide important information relating to the size, shape and distribution of nano and micropores.

01507 588353

Winceby House, Winceby, Horncastle, Lincolnshire LN9 6PB

View our offices

© 2025 Badley Ashton & Associates Ltd

Website by Yello